
If you have ever searched for the Hometrack House Price Index, you probably wanted one of two things: the latest UK house price figures, or a straight answer on where that index went. Both are fair questions. Hometrack was a familiar name in UK property data for years, and its work still sits behind one of the country’s most-watched price trackers today.
What is the Hometrack House Price Index?
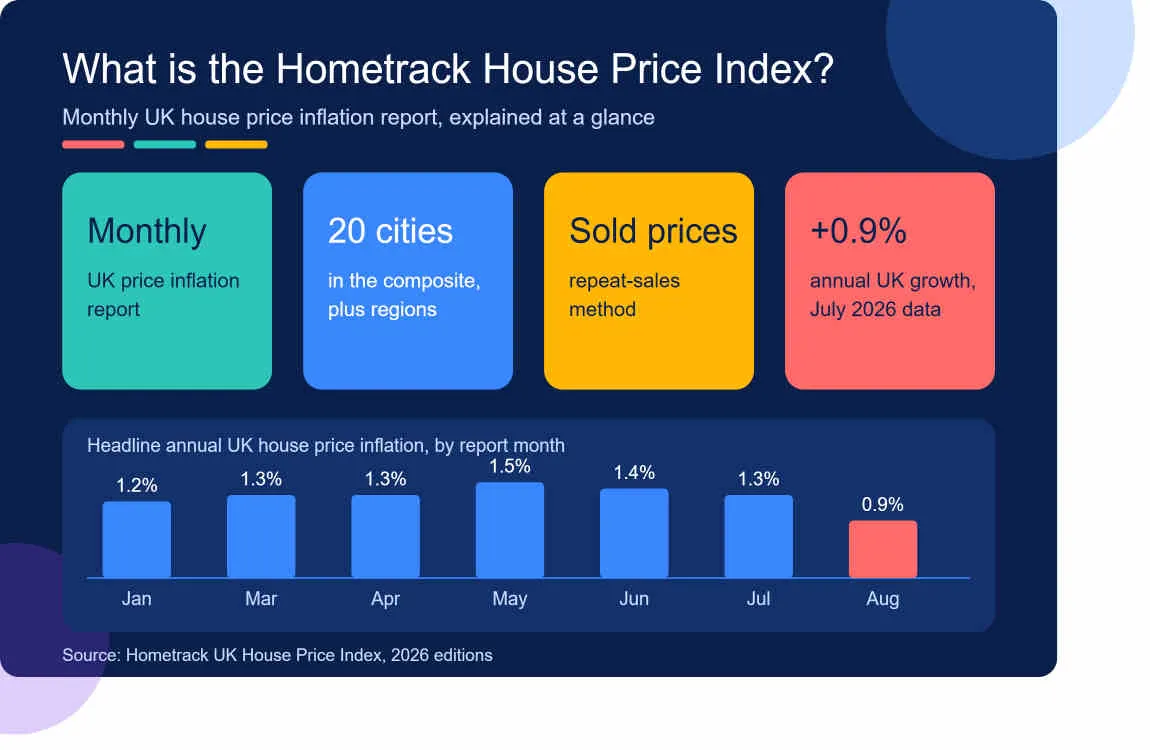
Hometrack describes its indices as a way to track, as closely as possible, how the capital value of UK homes moves over time. According to the company’s own index page, the series feeds into its automated valuation model and covers 20 UK cities, plus the wider UK, government regions and the countries of Scotland, Wales and Northern Ireland.
The index you may remember wasn’t always built this way. Back in 2014, Estate Agent Today reported that Hometrack was dropping its old monthly survey, which relied on feedback from thousands of agency offices, in favour of a city-level index based on Land Registry and Registers of Scotland data. It was a shift from opinion to recorded sales, and it made the figures far easier to defend.
Why does the name Hometrack now lead to Zoopla?
In January 2019, the monthly cities index that had run for years under the Hometrack banner was rebranded as a Zoopla product. The underlying numbers still came from Hometrack data; only the label on the front changed. That is why a search for the Hometrack House Price Index today lands you on Zoopla’s monthly report.
How the index is calculated
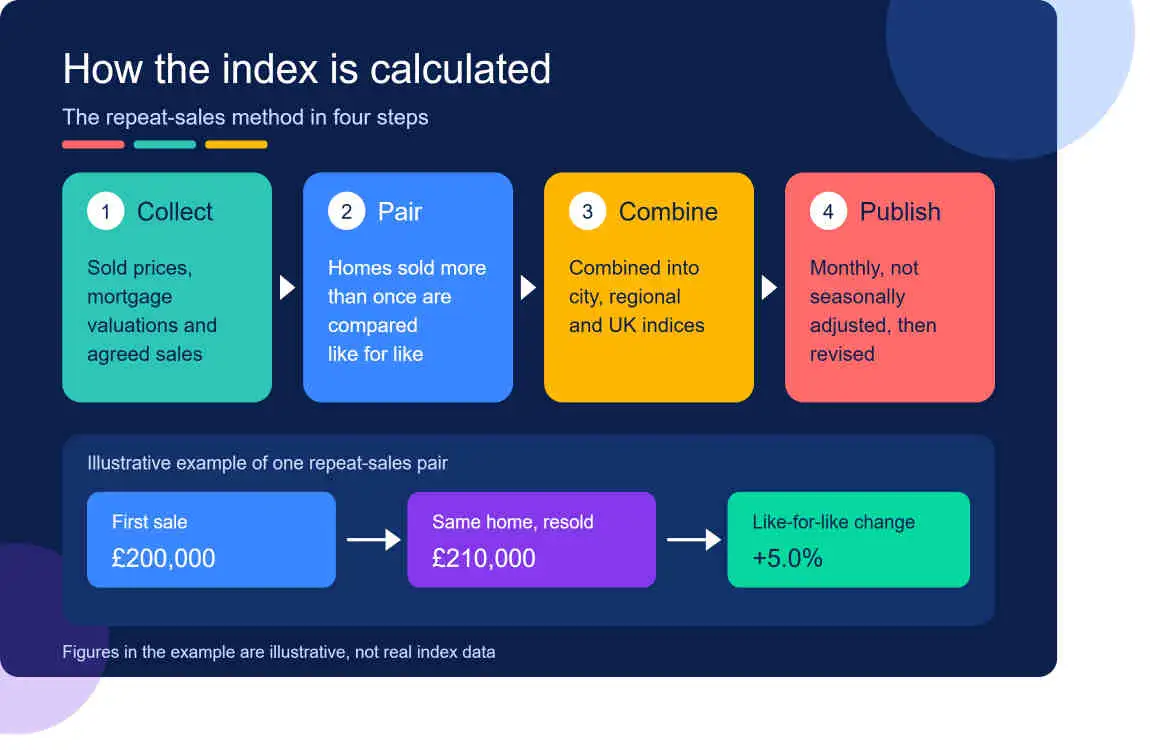
Zoopla’s version tracks the achieved sales price of real estate homes rather than asking prices. Per its published methodology, it combines sold prices, mortgage valuations and data on recently agreed sales, and it follows prices across 119 postal areas. Two details are worth knowing:
- It is revisionary. Early readings can be adjusted as more sales complete, as with other UK price indices.
- It is not seasonally adjusted. Month-to-month moves can include normal seasonal patterns, so annual change is the number to watch.
The latest numbers: October 2026
The newest release, published on 27 October 2026, shows the average UK house price at £273,100. That is a rise of £2,200, or 0.8%, over the past year, according to the Zoopla House Price Index. Growth is positive but thin, and it has cooled from earlier in the year.
Mortgage costs are the main reason. Mortgage Strategy reported that higher rates have added around £150 a month, or £1,800 a year, to average repayments compared with the start of 2026. Zoopla’s Richard Donnell links the pressure to the Middle East conflict pushing up energy prices and mortgage rates.
Prices by property type
| Property type | Average price (Sept 2026) | Annual change |
|---|---|---|
| All property | £273,100 | +0.8% |
| Flats / maisonettes | £191,200 | -2% |
| Terraced houses | £282,900 | +1.6% |
| Semi-detached houses | £324,600 | +1.3% |
| Detached houses | £459,100 | +0.8% |
Flats being the weak spot makes sense when you consider who buys them. First-time buyers and investors tend to be the most rate-sensitive, and both groups have felt the squeeze.
The North–South divide is widening
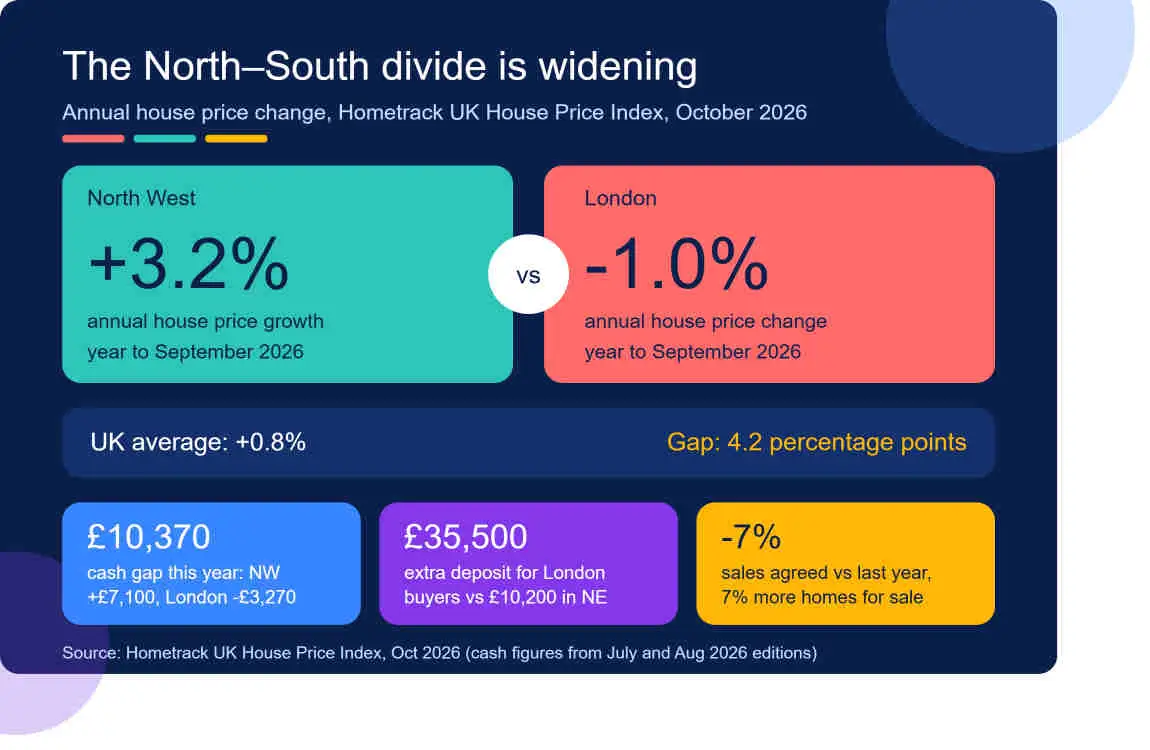
This is the story behind the average. In London and the South East, prices are falling in 85% of postcode areas, and London is 1% lower than a year ago, a drop of £5,400. Meanwhile, the North West is 3.2% higher, up £6,600, with Liverpool, Carlisle and Kilmarnock postcode areas rising more than 4%.
Across the whole index, 37 of the 119 postal areas recorded annual falls in September. Those areas hold 35% of UK homes, so a large slice of owners is living in a flat or falling market even while the headline stays positive.
Speed of sale tells the same two story house. Homes that sell take 44 days on average to find a buyer, the same as last year. That ranges from 19 days in Scotland, where the buying process is different, to 56 days in London.
Buyers have more choice, sellers have more competition
Sales agreed are 7% lower than a year ago, while the number of homes for sale is up 7%. A month earlier the gap was 9% fewer sales and 5% more stock, so the sales figure is moving in the right direction even though stock is building. In plain terms, buyers are being choosier and have the leverage to negotiate.
Why the asking price matters more than ever
One of the most useful findings in this release has nothing to do with the national average. For homes listed between April and June 2026, 41% of those priced below their estimated value found a buyer within 90 days. Only 26% of those priced at least 20% above value managed it.
Cutting the price later is not a magic fix either: just 19% of homes with a reduction sold within 90 days, against 41% with no reduction. The first days on the market attract the most attention, so getting the number right from day one counts.
How does it compare with the official figures?
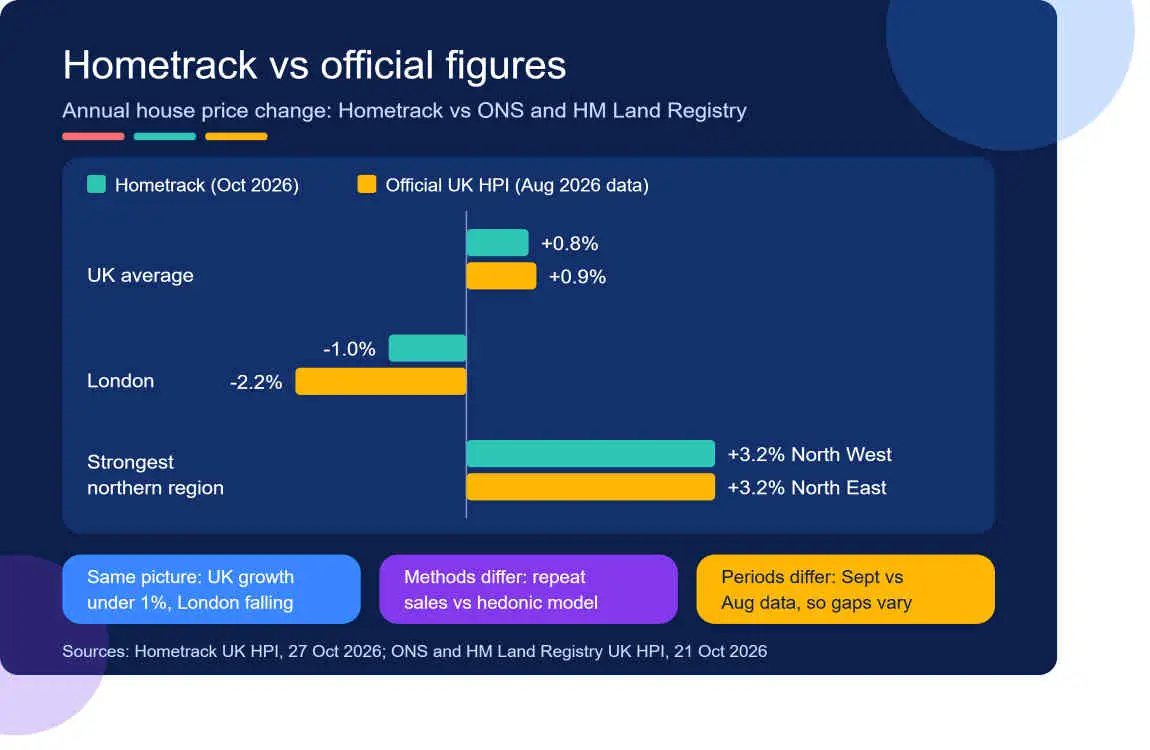
It helps to cross-check against the government’s own data. The HM Land Registry UK House Price Index for August 2026 put average UK annual inflation at 0.9% (a provisional estimate) with the average price at £273,000. That lines up closely with Zoopla’s reading, which is reassuring: two different methods, same story of slow growth.
What happens next?
Zoopla expects annual house price growth to drift towards 0.5% by the end of 2026, with annual sales closer to 1.1 million versus 1.2 million last year. The direction of mortgage rates is the swing factor for 2027. The firm notes the upcoming Budget may matter most through its effect on borrowing house costs rather than through direct buyer help, and that the proposed Your First Home equity loan scheme could support demand for new builds if its income caps and price limits are set well. Details are not yet confirmed.
Frequently asked questions
Is the Hometrack House Price Index still published?
The monthly index that used to carry the Hometrack name has been published under the Zoopla brand since January 2019, using Hometrack data. Hometrack also states on its site that its indices are available to license for commercial use.
Are house prices going up or down in the UK?
Overall, slightly up: 0.8% over the year to September 2026. Regionally, London and much of southern England are falling while the North West and other northern markets are still rising.
What is the average UK house price right now?
£273,100 on Zoopla’s October 2026 index. The Land Registry’s August 2026 figure was £273,000.
How long does it take to sell a house in the UK?
About 44 days on average to find a buyer, from 19 days in Scotland to 56 in London.
Is the Hometrack index based on asking prices?
No. It uses achieved sales prices, mortgage valuations and recently agreed sales, not asking prices.
