

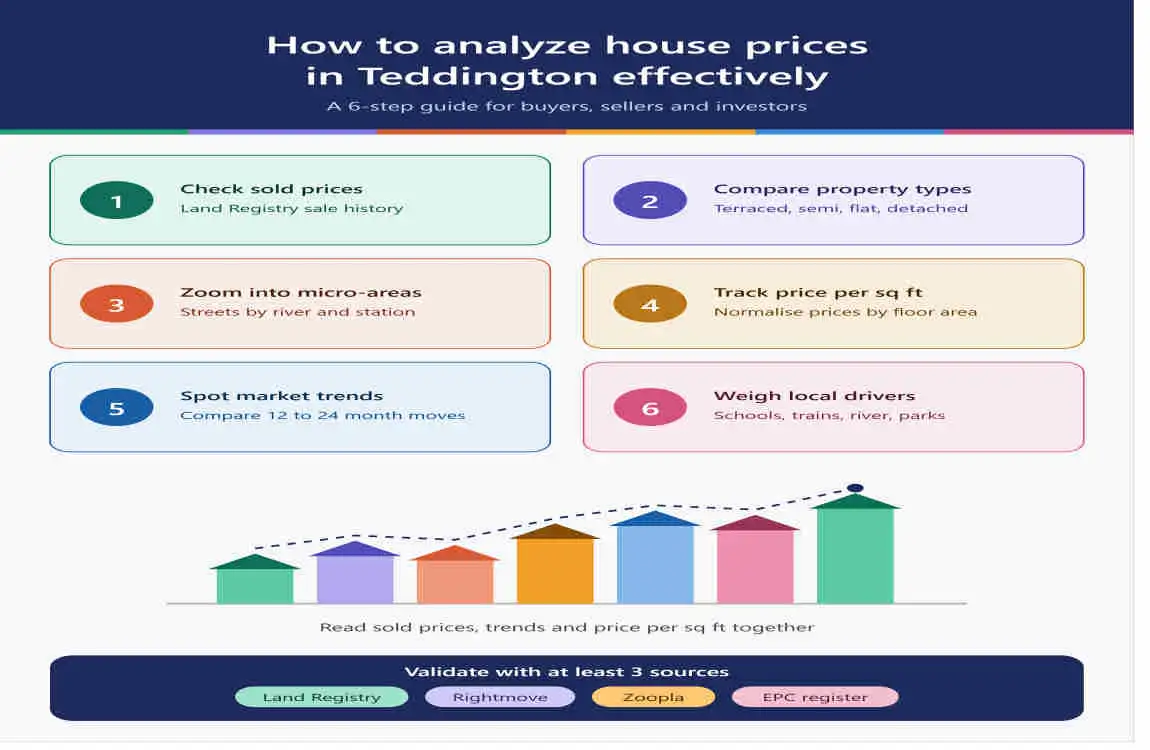
Ask three estate agents about house prices in Teddington and you may hear three different numbers. One will quote an average of around £650,000, another will say £900,000, and a third will tell you detached homes here regularly go past £1.5 million. None of them is necessarily wrong. They are simply measuring different things.
If you are buying, selling or investing in this corner of south-west London, knowing how to read the numbers matters more than memorising any single figure.
Why Teddington Prices Are Hard to Pin Down
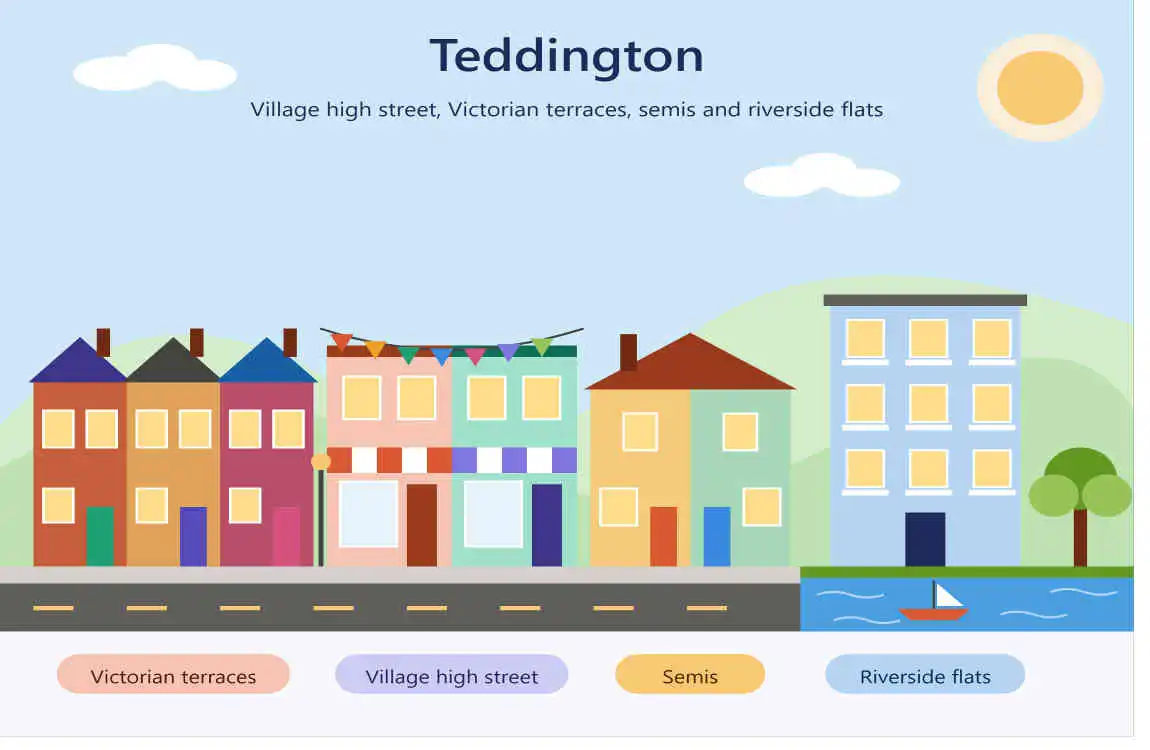
Teddington sits in the London home Borough of Richmond upon Thames, between Bushy Park and the Thames. Buyers are drawn by the schools, the green space and the fast rail links into central London, a combination that Savills highlights as a key reason demand holds up here.
The challenge is that the TW11 postcode contains very different homes. A one-bedroom flat near the station and a five-bedroom Edwardian house near the park belong to different markets, yet many websites blend them into one headline average. That is why the first rule of analysis is simple: never trust a single number.
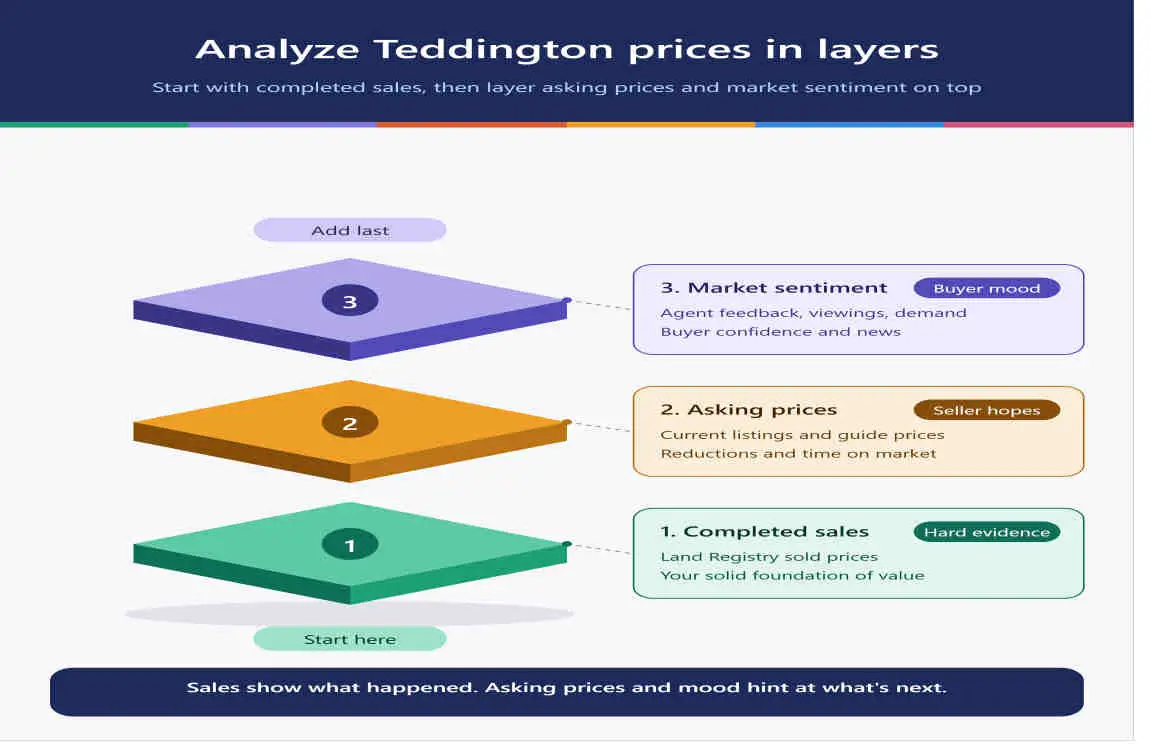
Start With Official Sold-Price Data
Asking prices show what sellers hope for. Sold prices show what buyers actually paid. For the second, the most reliable source is HM Land Registry, which records completed residential sales in England home and Wales. You can search individual streets and postcodes through the government’s Price Paid Data search.
For the bigger picture, the UK House Price Index is published monthly. Its latest release at the time of writing, for May 2026, showed UK prices up 0.3% on the month and 2.7% over the year. Teddington does not have its own line in that headline, but it gives you the national backdrop to compare against.
Compare Teddington With the Wider Borough
Because Teddington is part of Richmond upon Thames, borough-level statistics are a useful benchmark. The Office for National Statistics reported a provisional average price of £785,000 for the borough in October 2025, down 3.5% from the year before. Semi-detached homes fell 1.8% and flats fell 5.4% over the same period, according to the ONS local housing dashboard.
More recent commercial indices tell a similar story of a market that is steady rather than surging. Zoopla’s index, published through Hometrack, put the borough average at roughly £748,900 in its August 2026 London summary, with annual movement slightly negative at around 0.5%.
Notice that these two figures differ. That is normal. Each index uses its own method, dataset and time window, so the useful question is not “which is right?” but “which direction is the trend pointing across all of them?”
Break Prices Down by Property Type
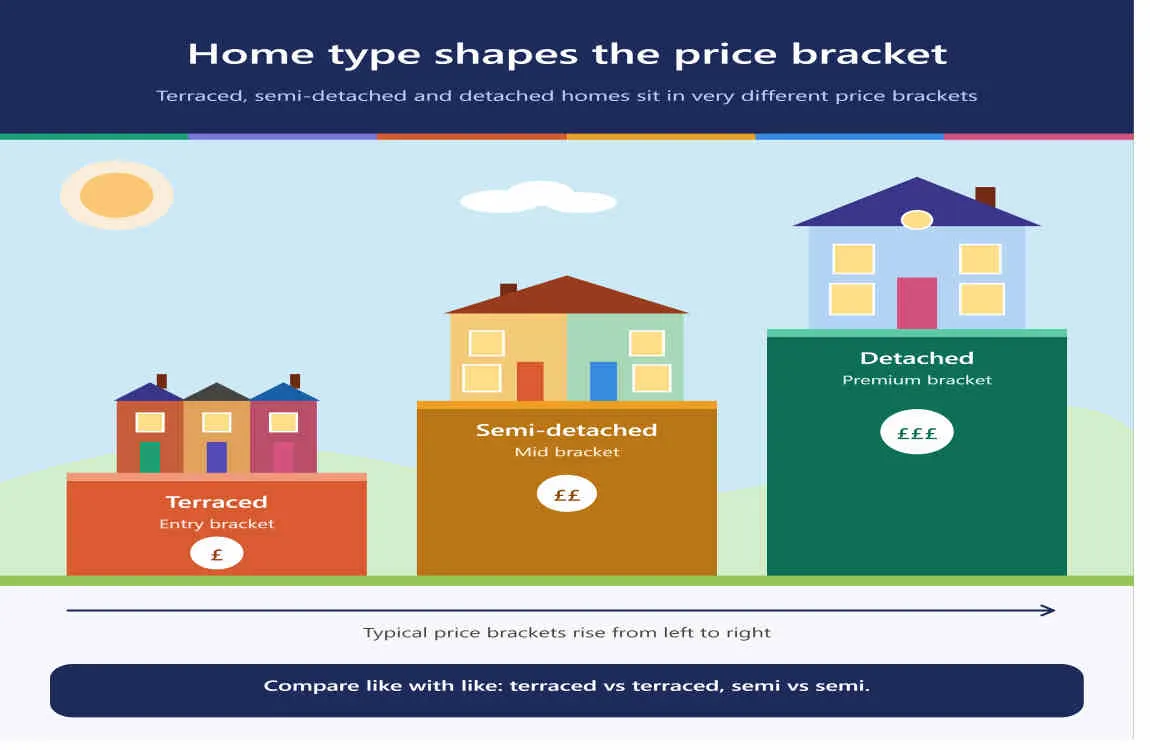
This is where most people go wrong. Teddington’s market is really four markets: flats, terraced houses, semi-detached houses and detached houses.
As a rough illustration, a sold-price summary for TW11 over a three-year window, compiled from Land Registry-based figures, showed averages of about £531,000 for flats, £929,000 for terraced homes, £1.27 million for semi-detached homes and £1.68 million for detached homes. Treat those as indicative, not exact, but the spread is the point: a buyer budgeting £700,000 is in a completely different segment from one budgeting £1.5 million.
Compare Asking Prices With Sold Prices
The gap between what sellers ask and what buyers pay tells you who has the upper hand. Listing-based sources can help here. Foxtons, for example, shows Teddington listing values with an average flat price of around £430,000 and an average house price of around £1.485 million, based on the agency’s own current listings.
Another portal, GetAgent, reported an average property Teddington asking price of about £926,000, with homes taking around 15 weeks to reach offer stage and typical asking-price reductions of 2.8%, per its Teddington market page. Longer selling times and visible reductions suggest buyers have some room to negotiate, particularly on properties that have been listed for a while.
Look at Price Per Square Foot
Headline prices hide size differences. A £900,000 house can be good value or poor value depending on its floor area. Dividing price by square footage gives a fairer comparison between a compact renovated cottage and a larger, dated family home.
You can find floor area for most homes on the government’s Energy Performance Certificate register. Pair that with sold prices from the Land Registry and you can calculate your own price per square foot for any street. Comparing three to five similar sales within a few hundred metres usually gives a more honest valuation than any online estimate.
Check the Micro-Location
Within Teddington, small differences carry real weight. When you compare homes, check:
- Distance to the station and the high street, which affects commuter appeal.
- Proximity to Bushy Park and the river, which tends to add a premium.
- School catchment areas, which families often prioritise above almost everything else.
- Flood risk and road noise, which can quietly pull values down.
- Condition and extension potential, since loft and rear extensions can change a real estate home’s value bracket.
Two houses on neighbouring roads can sell for very different amounts for exactly these reasons. Walk the area at different times of day before you trust a spreadsheet.
Factor In Mortgage Costs and Affordability
Prices only matter in relation to what buyers can borrow. Nationwide’s House Price Index data on deposits shows the scale of the challenge in this part of London: its March 2026 report listed a typical deposit of about £61,900 in Richmond upon Thames, placing it among the more expensive boroughs for first-time buyers, as shown in the Nationwide House Price Index.
When interest rates fall, borrowing power rises and prices often firm up. When rates climb, sellers may need to adjust. Always check current mortgage rates alongside price data rather than looking at prices in isolation.
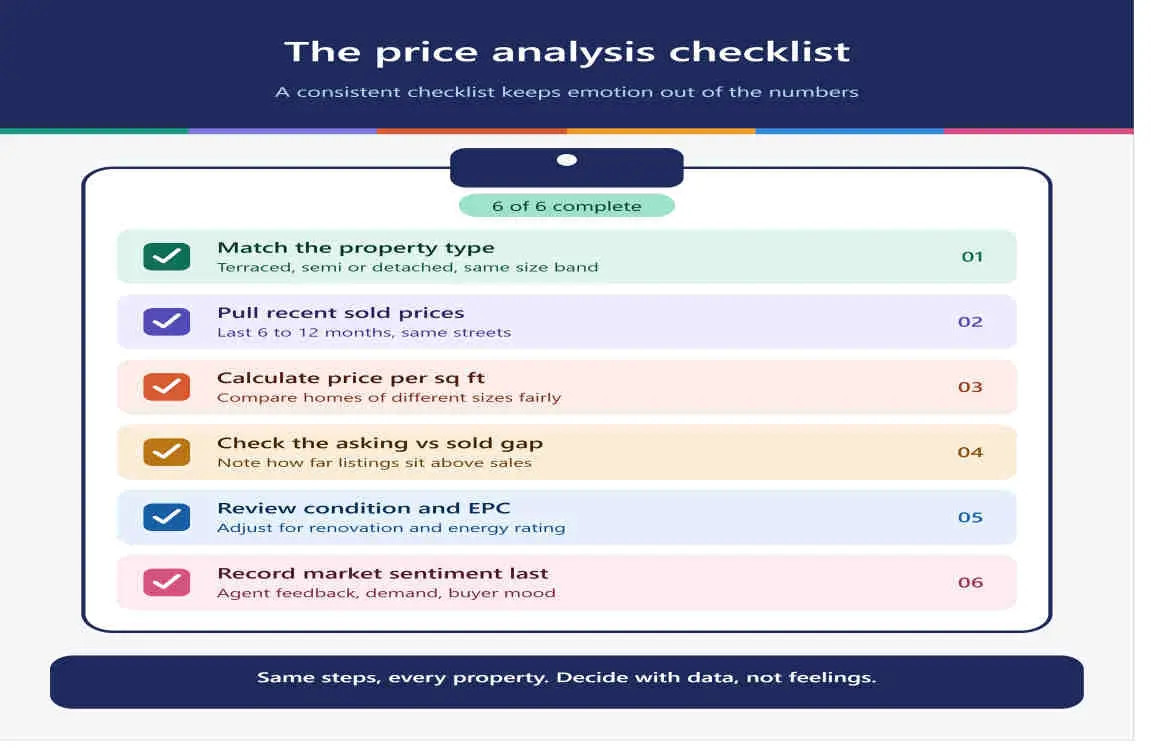
A Simple Checklist for Analysing House Prices in Teddington
- Pull recent sold prices for your exact street and property type from the Land Registry.
- Compare them with the Richmond upon Thames trend from ONS and Zoopla.
- Check asking prices, time on market and price reductions on at least two portals.
- Calculate price per square foot using EPC floor areas.
- Adjust for condition, garden, parking and distance to the station.
- Look at mortgage costs and your own budget before making an offer.
Frequently Asked Questions
What is the average house price in Teddington?
It depends on the source and the property mix. Published figures range from the mid £600,000s to over £900,000, because some sites include flats and others focus on houses. Always check which property types and dates a figure covers.
Where can I find real sold prices in Teddington?
The official source is HM Land Registry’s Price Paid Data. Portals such as Rightmove and Zoopla display the same underlying sales in a more searchable format.
Are house prices in Teddington rising or falling?
Borough-level indices point to a broadly flat market with small annual movements, while individual streets and property types can behave differently. Check the most recent release before making decisions.
Is now a good time to buy in Teddington?
That depends on your finances, plans and risk tolerance. This article is general information, not financial advice, so consider speaking to a qualified mortgage adviser or independent surveyor.
Final Thoughts
The best way to understand house prices in Teddington is to treat every statistic as one piece of evidence rather than the answer. Combine official sold-price data, borough trends, asking-price behaviour and street-level detail, and you will form a far clearer picture than any single headline average can give you.
